Performance Test of Asterisk
Performance Test of Asterisk V1.4 as a Back to Back User Agent (B2BUA)
Introduction
This document describes a benchmark test and performance results for Asterisk PBX working as B2BUA. The purpose of this stress test is to understand the performance boundary of Asterisk B2BUA in production environments. To simulate a production environment, the Asterisk queries an external OSP server for routing information on each call and then reports call detail records to the external OSP server. Five destinations are returned to the Asterisk for every call in random order. Four of the five destinations simulate call failure scenarios so the Asterisk must retry the call an average of two times before the call is completed. The two-way conversation simulation for each test call is an RTP stream of music proxied from the source through Asterisk to the destination and then echoed back to the source via Asterisk.
This is an “out of the box” test of Asterisk with no configuration changes made to improve performance. The test cases were performed on a server with an Intel Xeon X3220 Quad core, 2.40 GHz, CPU and 4 GB RAM.
Summary of Performance Results
TransNexus believes the guidelines are given here are conservative and safe for production network planning. TransNexus expects that users can experience higher call throughput by optimizing their Asterisk implementation. For production operations (with call retries and CDR reporting), TransNexus recommends the following guideline for sizing server hardware for Asterisk Ver1.4.21.2:
For a server hosting Asterisk, each One GHz of CPU processing capacity can manage 100 simultaneous calls without codec translation (G711 ulaw) or 30 simultaneous calls with G711 ulaw to G729 codec translation.
For this guideline, TransNexus defines a server’s CPU processing capacity as the total number of CPU cores * the CPU clock speed. For example, a server with a Quad core, 2.4 GHz CPU would effectively have 9.6 GHz of CPU processing capacity (1 CPU * 4 cores * 2.4 GHz per CPU). This server, hosting Asterisk Ver1.4.21.2, would be able to manage 960 simultaneous calls without codec translation or 288 simultaneous calls with G.711 ulaw to G.729 codec translation at approximately 95% CPU utilization.
Cost Per Port Analysis
The total cost of the Dell server used for this test was just less than $1000. The cost per port of using Asterisk as a B2BUA for G.711 to G.711 VoIP calls is about $1/port.
$1000 server cost / 960 simultaneous calls = $1.04 per port.
The cost per port of using Asterisk as a B2BUA with transcoding from G.711 to G.729 is about $13.50 per port. This is based on a $1000 server cost at $10 royalty fee per G.729 channel.
[$1000 server cost + ($10 per G.729 channel * 288 channels)] / 288 ports (simultaneous calls) = $13.47 per port
Results for G.711 to G.711 (No Codec Translation)
CPU Utilization
The following chart plots CPU utilization as a function of simultaneous calls.

RTP Packet Quality
The following chart provides an indication of how audio quality would degrade as a function of CPU utilization. This charts plots the percent of RTP packets with a delay greater than 50 milliseconds and the percent of packets that are out of sequence. This data was collected using WireShark. This data indicates that call quality should be acceptable up to very high CPU utilizations.
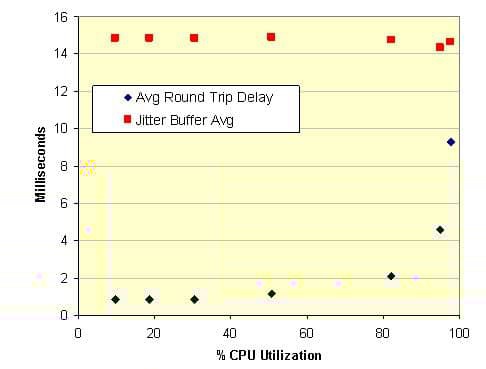
RTP Packet Delay
The following chart plots the average round trip delay for RTP packets and the average jitter, both in milliseconds, versus CPU utilization. Jitter was calculated according to RFC 3550. This data indicates acceptable call quality up to very high CPU utilization.
Results for G.711 to G.729 (Codec Translation)
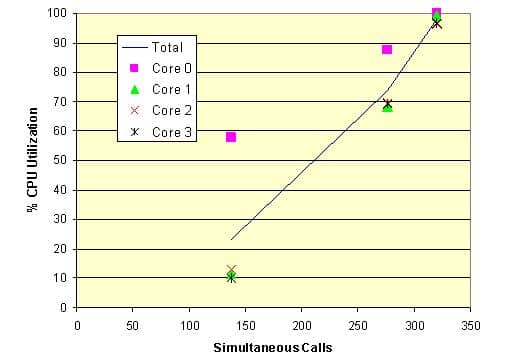
CPU Utilization
The following chart plots CPU utilization as a function of simultaneous calls.
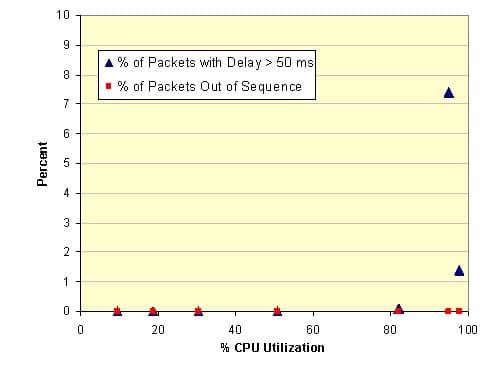
RTP Packet Quality
The following chart provides an indication of how audio quality would degrade as a function of CPU utilization. This charts plots the percent of RTP packets with a delay greater than 50 milliseconds and the percent of packets that are out of sequence. This data was collected using WireShark. This data indicates that call quality should be acceptable up to very high CPU utilizations.

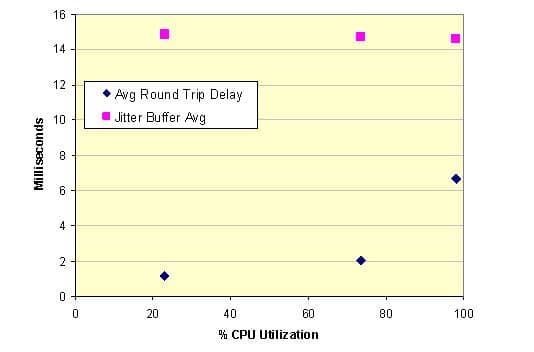
RTP Packet Delay
The following chart plots the average round trip delay for RTP packets and the average jitter, both in milliseconds, versus CPU utilization. Jitter was calculated according to RFC 3550. This data indicates acceptable call quality up to very high CPU utilization.